
How to Justify Maintenance vs Replacement Costs for Facility Assets
Table of Contents
- Why Maintenance vs Replacement Decisions Stall (and What Data Changes That)
- A Step-by-Step Repair or Replace Decision Analysis for Facility Assets
- Facility Asset Lifecycle Cost Analysis: Total Cost of Ownership in Practice
- Equipment Replacement Decision Examples: Steel Frames, Aluminum Frames, and Doors
- How to Build an Asset Replacement Business Case Template Leadership Will Approve
- Risk-Adjusted Costs of Failure: Downtime, Reliability, and Operational Impact
- Conclusion: Turn Maintenance vs Replacement Into a Repeatable Portfolio Process
- Frequently Asked Questions
Last Updated: October 12, 2026
Why Maintenance vs Replacement Decisions Stall (and What Data Changes That)
Most facility teams don't struggle to fix a door, they struggle to defend the fix.
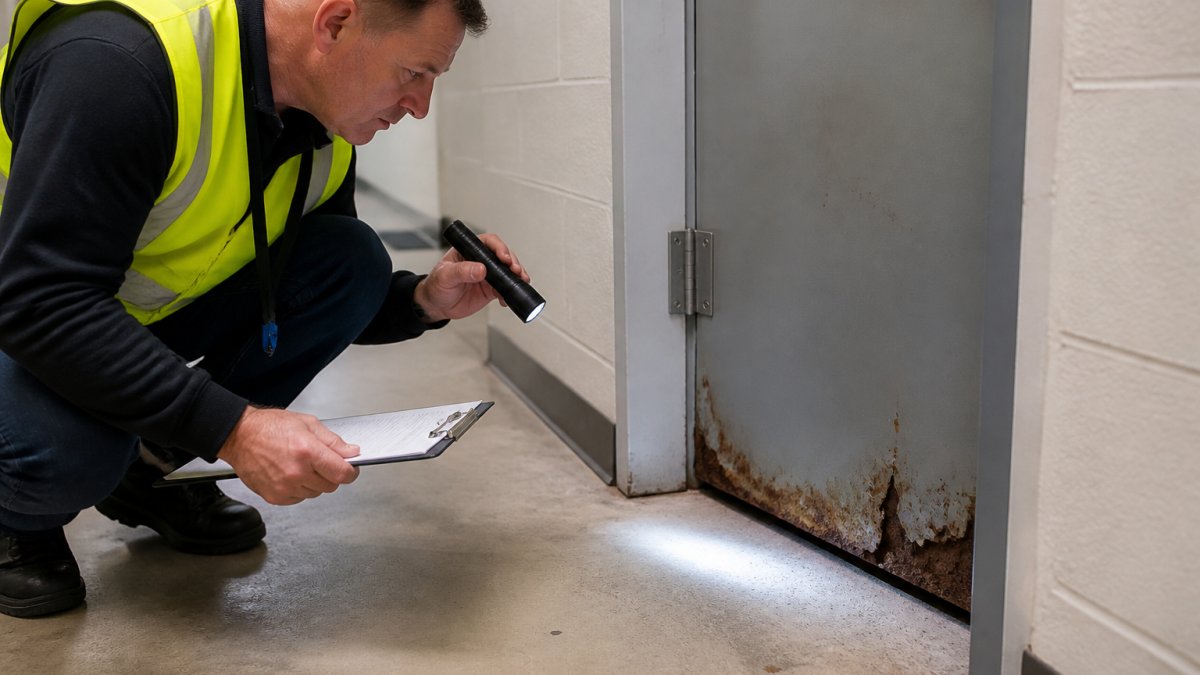
The fix isn't a bigger budget, it's better data. Show leadership the repair cost, replacement cost, asset condition, and risk of doing nothing, and the decision makes itself.
Door Innovation builds repair kits for exactly this moment: rusted steel and corroded aluminum frames that don't need to come out yet.
A Step-by-Step Repair or Replace Decision Analysis for Facility Assets
A repair or replace decision analysis compares what it costs to keep an asset running versus replacing it, measured over the same period. Do it in three steps: gather costs, score condition, apply thresholds.
Step 1: Gather Repair Costs, Replacement Costs, and Operating Costs
Pull three numbers for each asset:
- Repair cost: parts plus labor for the fix you're considering
- Replacement cost: new frame, door, hardware, disposal, and labor
- Operating cost: what you spend yearly to keep it working, including callbacks
A common mistake is comparing repair cost to replacement cost alone. Replacement also resets the clock on future repairs, real value to weigh against the higher upfront spend.
Step 2: Score Asset Condition and Estimate Remaining Useful Life
Score each frame on a simple scale:
- Rust or corrosion depth: surface only, or past the metal?
- Structural integrity: does the frame still hold the door square?
- Hardware mounting: do hinges and strikes still bite?
Surface-level rust on a solid frame means remaining useful life is years, not months, that's a repair. If metal is gone at the hinge or strike, replacement moves up the list.
Step 3: Apply Decision Thresholds and Run a Sensitivity Check
Set a threshold before you start so the decision isn't personal:
- Repair cost under roughly half of replacement cost, and the frame still structurally sound: repair
- Repair cost above that, or the frame is failing structurally: replace
- Repair cost close to the threshold: run a sensitivity check
A sensitivity check means asking "what if I'm wrong?" If labor runs higher, does repair still win? If the frame fails in two years, does the math hold? If the answer flips on a small change, get a second opinion.
Facility Asset Lifecycle Cost Analysis: Total Cost of Ownership in Practice
Facility asset lifecycle cost analysis compares total cost of ownership across an asset's full life, not just purchase price. For a door frame, that means repair, replacement, operating, downtime, energy or access-control, and disposal costs, all measured over the same horizon so the paths are comparable.
Most guides stop at a side-by-side table. That's a starting point, not an answer, the answer comes from putting every cost on the same timeline and discounting future dollars to today.
The TCO Formula
For each option, total cost of ownership over an N-year horizon is:
TCO = Initial cost + Σ (annual operating cost ÷ (1 + r)^t) + Σ (expected repair cost ÷ (1 + r)^t) + disposal cost ÷ (1 + r)^N − residual value ÷ (1 + r)^N
Where r is the discount rate (many facility teams use finance's published rate), t is each year in the horizon, and N is the comparison horizon (use the shorter expected life so both options share a window).
Worked Example: Rusted Steel Frame, 10-Year Horizon
Assume a discount rate of 5% and a 10-year horizon. Numbers below are illustrative, substitute your own.
Repair path (patch the rusted base):
- Initial repair cost: $1,200 (parts + labor)
- Expected life added: 8 years, then a second patch at year 8: $1,400
- Annual operating cost (inspection, minor touch-ups): $50/year
Replacement path (new frame):
- Initial replacement cost: $4,500 (frame, hardware, disposal, labor)
- Expected life: 20 years, so no repeat spend inside the horizon
- Annual operating cost: $20/year
Rough comparison over 10 years:
- Repair path: ~$1,200 + ~$950 (year-8 patch, discounted) + ~$400 (operating, discounted) ≈ $2,550
- Replacement path: ~$4,500 + ~$160 (operating, discounted) − ~$1,400 (residual, discounted) ≈ $3,260
On these assumptions, repair wins by roughly $700 in present-value terms. Change the discount rate, second-repair timing, or residual value and the gap narrows or flips, that's the point of running the math.
What Belongs in the Comparison
| Cost Category | Repair Path | Replacement Path |
|---|---|---|
| Upfront cost | Lower | Higher |
| Labor | Same crew, same day | Contractor, scheduled |
| Downtime | Minimal | Door out of service |
| Future repairs | Possible, reduced | Reset for years |
| Disposal | None | Old frame removed |
| Energy / access control | Unchanged | May reset or upgrade |
| Life added | Years | Full service life |
| Residual value | None | Real, if sold or reused |
Repair usually wins on cash flow and downtime; replacement usually wins on certainty and residual value. Neither is always right.
The Cost Most Guides Leave Out
Lifecycle cost isn't just dollars. A door out of service in a healthcare facility, retirement home, or school is a safety and access problem that never shows on the invoice. Assign it a dollar figure, even rough, so it enters the comparison.
Funding and Accounting Reality
A lifecycle comparison that ignores how money is actually spent won't survive a budget review. Three mechanics decide timing as much as the math:


- Operating vs. capital budget: repairs typically come out of the operating budget, replacements out of capital. A repair that fits this year's operating budget may be approved faster than a replacement that has to wait for next year's capital cycle.
- Depreciation: a replacement resets the depreciation schedule, which affects the book value of the asset and, in some organizations, the reported cost of the facility.
- Lead times: replacement frames, doors, and hardware can carry multi-week lead times. A repair that keeps the opening functional now may be the only option that meets the operational need, regardless of the math.
Run the TCO comparison first, then check it against the funding calendar. The best answer is cheaper over time and fundable this cycle.
Equipment Replacement Decision Examples: Steel Frames, Aluminum Frames, and Doors
Different assets fail differently, so the decision math changes with the material.
Steel frames with rust at the base. Rust concentrates at the bottom where water and salt collect. Shallow rust: patch it.
Aluminum frames that have come loose. Aluminum corrodes from salts, cleaning solutions, and cart impacts, pulling away from the wall, an anchoring problem, not a metal problem. The Jamb Anchor Center Jamb Kit re-anchors loose aluminum frames without replacement.

Doors themselves. A damaged door slab is usually a door problem, not a frame problem. Check the frame before you assume the whole opening needs to come out.
How to Build an Asset Replacement Business Case Template Leadership Will Approve
An asset replacement business case template gets your recommendation approved. It needs four things: current condition, both options with costs, risk of each, and your recommendation.
Use this structure:
- Asset ID and location
- Condition score and remaining useful life estimate
- Repair option: scope, cost, expected life added
The last two lines separate an approved case from a stalled one, leadership wants to know you stress-tested the number.
Risk-Adjusted Costs of Failure: Downtime, Reliability, and Operational Impact
Risk-adjusted cost is the repair or replacement cost plus the expected cost of failure, weighted by likelihood. Two options with the same price tag aren't equal if one carries more failure risk.
Most guides describe this idea; few show the math. Here it is.
The Risk-Adjusted Cost Formula
Risk-adjusted cost = Direct cost + (Probability of failure × Consequence of failure)
Where:
- Direct cost = the repair or replacement cost you already calculated
- Probability of failure = your best estimate that the asset fails within the decision horizon (use your work-order history, inspection findings, or a simple low/medium/high mapped to a number)
- Consequence of failure = the dollar cost of the failure event itself: downtime, emergency labor, collateral damage, safety or compliance exposure
Worked Example: Two Options, Same Sticker Price
Two rusted steel frames, both with a $1,200 repair quote.
Frame A, surface rust, solid metal, no prior failures:
- Probability of failure in the next 3 years: low, call it 10%
- Consequence if it fails: door sticks, minor downtime, ~$800 in emergency labor and disruption
- Risk-adjusted cost: $1,200 + (0.10 × $800) = $1,280
Frame B, rust past the metal at the hinge, two prior failures this year:
- Probability of failure in the next 3 years: high, call it 60%
- Consequence if it fails: door out of service in a patient area, safety exposure, ~$4,000 in downtime, emergency repair, and collateral damage
- Risk-adjusted cost: $1,200 + (0.60 × $4,000) = $3,600
Same repair quote. Nearly three times the risk-adjusted cost. That is the number to put in front of leadership.
Where Failure Cost Shows Up
For facility assets, consequence of failure lands in four places:
- Downtime: a door out of service blocks access, delays staff, and disrupts operations. Estimate the hourly cost of that disruption and multiply by expected hours out of service.
- Reliability: a frame that fails repeatedly costs labor every time. Add the callback labor and the staff time spent managing it.
- Safety and compliance: in healthcare, retirement, and education settings, a failed door is a safety, security, and in some cases a code-compliance issue. Assign a dollar figure even if it is a range.
Sensitivity: What Changes the Answer
The risk-adjusted number is only as good as its inputs. Sensitivity-check the two that move the result most:
- Probability: if you are wrong about how likely failure is, does the recommendation flip? If yes, get a second inspection before committing.
- Consequence: if downtime costs twice what you assumed, does repair still win? In safety-critical settings, it often does not.
A cheap repair that fails in six months isn't cheap. Add callback labor, downtime, and risk exposure, and the real cost climbs fast, which is why the condition score matters as much as the price.
When you present the case, show both the sticker cost and the risk-adjusted cost. Leadership responds to risk, not just line items.
Conclusion: Turn Maintenance vs Replacement Into a Repeatable Portfolio Process
The hardest part of the maintenance vs replacement decision isn't the math. It's doing it consistently across dozens of assets, every budget cycle, without re-litigating the same arguments.
Build the process once: gather costs, score condition, apply thresholds, run the sensitivity check, and document the case. Then repeat it. Over time, your portfolio data tells you which assets are repair candidates and which are ready for capital planning.
Door Innovation makes the repair side of that process practical. Our Jamb Patch and Jamb Anchor kits restore rusted steel and corroded aluminum frames with a simple three-step install, no special training required, so your team can extend the life of existing door openings and save on replacement costs.
Frequently Asked Questions
What costs should be included in a repair-versus-replacement analysis?
Include repair costs (parts and labor), replacement costs (unit, installation, disposal, and any permits), and ongoing operating costs like preventive maintenance, corrective maintenance, and downtime. Add risk-adjusted costs: expected failure probability times the cost of failure, including safety incidents and lost operations. For a rusted steel frame, a Jamb Patch kit at $180.91 plus labor often costs far less than a full frame replacement, so the repair side of the equation stays low while the asset keeps its remaining useful life.
How do you compare the cost of maintaining an asset with replacing it?
Compare total cost of ownership over the same horizon. For maintenance, add up repair costs, routine maintenance, and expected downtime over the next 5 years. For replacement, add capital costs, installation, and the new asset's operating costs. For isolated damage like rust under 2 inches, a Jamb Patch Kit at $130.37 extends life for a fraction of replacement cost.
How can facility managers justify a capital replacement to leadership?
Use an asset replacement business case template that shows the financial and risk case in one page: current asset condition, remaining useful life, annual maintenance spend trend, and the risk-adjusted cost of failure. Include a side-by-side total cost comparison over 5 years for repair versus replace. Leadership approves faster when the numbers show either a clear cost reduction or a risk reduction, not just a preference. Attach the maintenance budget history to show the trend.
How do you estimate the remaining useful life of a facility asset?
Start with the manufacturer's expected service life, then adjust for condition assessment. A Jamb Patch or Hinge Jamb Patch can restore a rusted steel frame and add years of life, while a Jamb Anchor kit re-anchors aluminum frames loosened by corrosion. Document the condition score and the repair method used so the next budget cycle has real data instead of guesswork.
Most facilities don't need to replace every aging frame. They need a defensible way to prove which ones to repair and which ones to replace. Door Innovation gives you the repair option that holds up to that scrutiny, with kits built for steel and aluminum frames, a three-step install your crew can handle, and a Certified Installer program for teams that want to go deeper. Order now and turn your next frame decision into a repair that lasts.