
5 Best Practices for Facility Maintenance Budgeting 2026
Table of Contents
- Practice 1: Build a Comprehensive Annual Facility Maintenance Budget
- Practice 2: Develop a Facility Maintenance Budget Template for Consistent Planning
- Practice 3: Prioritize Assets by Condition, Criticality, and Risk Exposure
- Practice 4: Implement Preventive Maintenance Budgeting to Reduce Long-Term Costs
- Practice 5: Use Facility Maintenance Software to Track Spending and Variance
- Real Facility Maintenance Budget Examples and Line-Item Allocation
- Common Budget Mistakes and How to Avoid Them
- Frequently Asked Questions
Last Updated: October 14, 2026
Practice 1: Build a Comprehensive Annual Facility Maintenance Budget
A comprehensive annual facility maintenance budget starts with knowing every asset in your building and what it costs to keep running, HVAC, roof, doors, flooring, electrical infrastructure, and more.
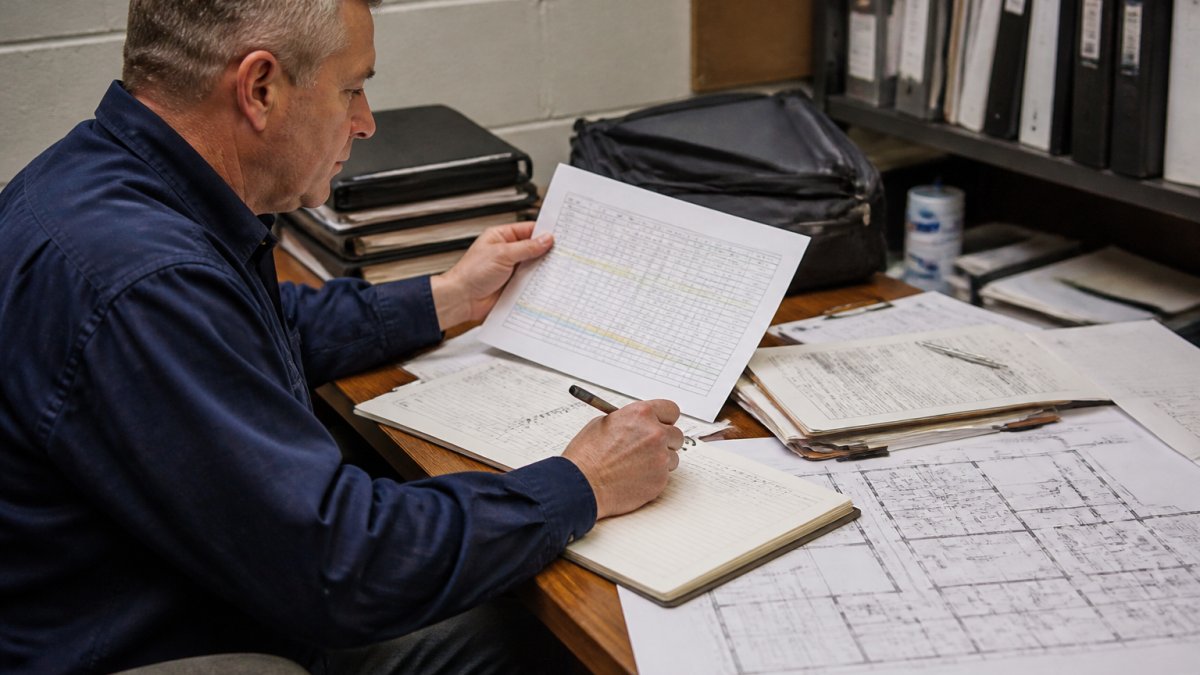
Next, split costs into operating expenses (routine maintenance, inspections, repairs) and capital expenses (replacements, major upgrades). Operating expenses repeat annually; capital expenses follow longer cycles and need separate planning.
Many facility managers miss hidden costs in their first budget. Factor in:
- Labor costs for your maintenance team
- Contractor fees for specialized work
- Parts and materials inventory
Practice 2: Develop a Facility Maintenance Budget Template for Consistent Planning
A facility maintenance budget template creates consistency year to year and makes spending patterns easier to track. A usable template needs a line-item structure, an allocation formula, and a variance column that rolls up monthly.
Layer 1: The line-item structure
Build your template as a grid. Rows are asset categories. Columns are cost types. Every cell is a dollar figure you can defend.
Rows (asset categories)
- HVAC and controls
- Plumbing and domestic water
- Electrical distribution and lighting
Columns (cost types per row)
- Preventive maintenance labor (internal hours × loaded rate)
- Preventive maintenance materials and filters
- Reactive/emergency labor
Derived columns
- Annual budgeted amount
- Year-to-date actual
- Variance ($ and %)
Layer 2: The allocation formula
Don't guess percentages. Anchor each row to a driver.
- Labor rows: (estimated hours per task × number of occurrences per year) × fully loaded hourly rate. Fully loaded means wages plus payroll taxes, benefits, and supervision. A common pattern is to multiply the base wage by roughly 1.25 to 1.4 to approximate the loaded rate.
- Materials rows: last year's actual consumption, adjusted for the asset count and any known price changes.
- Contractor rows: current contract value plus a renewal escalator. Many facility managers apply a 3-5% annual escalator to service contracts and a higher escalator to trades with acute labor shortages.
Layer 3: A worked example
A 50,000-square-foot commercial office with two packaged rooftop units, one elevator, and a parking lot might look like this at the row level:
| Row | PM labor | PM materials | Reactive | Contractor | Compliance | Reserve | Contingency |
|---|---|---|---|---|---|---|---|
| HVAC | $18,000 | $9,000 | $6,000 | $12,000 | $1,500 | $9,000 | , |
| Plumbing | $6,000 | $3,000 | $4,000 | $5,000 | $1,000 | $3,000 | , |
| Electrical/lighting | $5,000 | $4,000 | $3,000 | $4,000 | $500 | $4,000 | , |
| Roofing/envelope | $2,000 | $2,000 | $3,000 | $6,000 | , | $8,000 | , |
| Doors/frames/hardware | $3,000 | $2,500 | $2,000 | $2,000 | , | $2,000 | , |
| Fire/life safety | $2,000 | $1,000 | $1,000 | $4,000 | $3,000 | $1,500 | , |
| Elevator | , | , | $2,000 | $9,000 | $1,500 | $3,000 | , |
| Grounds/parking | $4,000 | $3,000 | $2,000 | $6,000 | , | $5,000 | , |
| Contingency pool | , | , | , | , | , | , | $12,000 |
Figures differ by market, building age, and climate, but the structure matters: every dollar has a driver and an owner.
Layer 4: Monthly roll-up and variance rules
A template only works if it produces a monthly variance report. Set three rules:
- Any row more than 10% over its year-to-date budget triggers a written explanation from the row owner.
- Any row projected to exceed 100% of annual budget by more than 5% triggers a reforecast and a mitigation plan (defer non-critical work, shift to reserve, or request a budget amendment).
- Contingency draws above $5,000 require a second approver.
Practice 3: Prioritize Assets by Condition, Criticality, and Risk Exposure
Not all maintenance needs are equal: a broken HVAC system in winter affects everyone, while a worn door frame in a storage closet can wait. Prioritization sends your maintenance dollars where they matter most. This section gives you the scoring model and deferral math to turn ratings into a ranked spend list.
Step 1: Score condition on a defined scale
Walk the facility and rate each major asset on a 1-5 condition scale. Write down the evidence, not just the number.
- 5 - Like new: no deferred work, within expected service life
- 4 - Good: minor wear, normal maintenance only
- 3 - Fair: visible deterioration, repairs needed within 12-24 months
Two raters should score independently and reconcile differences above one point, reducing the "everything looks fine" bias that creeps in when the same person maintains and grades the asset.
Step 2: Score criticality on operational impact
Criticality is about consequences, not price tag. Score each asset 1-5 on the worst credible failure outcome:
- 5 - Life safety or regulatory: fire systems, elevators, emergency egress, ADA-related hardware, life-safety doors
- 4 - Mission stoppage: asset whose failure halts operations (data center cooling, production air, main electrical)
- 3 - Significant disruption: occupant comfort or service quality degraded (main HVAC, restrooms, lighting in occupied areas)
Step 3: Score failure probability and exposure
Probability is where facility-specific risk factors enter. Rate 1-5 based on:
- Age relative to expected service life
- Environment (humidity, salt air, freeze-thaw cycles, heavy snow load)
- Duty cycle and load
Step 4: Calculate a priority score
A workable formula is:
Priority Score = Condition Risk × Criticality × Probability
Where Condition Risk = (6 − Condition Score). So a criticality-5 fire panel in condition 2 with probability 4 scores: (6 − 2) × 5 × 4 = 80. A cosmetic flooring asset in condition 3, criticality 1, probability 2 scores: (6 − 3) × 1 × 2 = 6. Rank all assets by score and fund from the top down until the budget is exhausted.
Step 5: Quantify deferred-maintenance exposure
Deferral is not free. For each asset pushed past its planned repair window, estimate:
- Escalation cost: repair cost today vs. repair cost in 12 months. A common pattern is 5-10% annual escalation for materials and labor, higher for trades in shortage.
- Failure cost: probability of failure × cost of failure (emergency labor premium, downtime, occupant impact, regulatory penalty). Emergency repairs frequently cost 2-3× the planned repair.
- Cascade cost: damage to adjacent systems. A leaking roof damages ceiling tiles, insulation, and electrical; a failed door frame lets in water that corrodes hardware and flooring.
Add the three numbers to get deferral exposure. If it exceeds the cost of doing the work now, deferring is a false saving.
Step 6: Turn scores into a ranked spend list
Produce a one-page ranked list with columns for asset, priority score, recommended action, cost, deferral exposure, and funding source (operating, reserve, or capital). Present it as a funding ladder: what you fund at 100%, what you fund at 80%, and what you defer, with the exposure you accept. That framing converts a maintenance request into a risk decision leadership can make.
Practice 4: Implement Preventive Maintenance Budgeting to Reduce Long-Term Costs
Preventive maintenance budgeting means spending now to avoid bigger expenses later.
The math is straightforward: replacing a door frame costs more than repairing it, but many facility managers assume replacement is the only choice. Door Innovation offers solutions like our Jamb Patch and Jamb Anchor kits for corroded aluminum and rusted steel frames.
Preventive maintenance budgeting means allocating funds for:
- Quarterly or semi-annual inspections of major systems
- Routine cleaning and lubrication
- Seal and weatherproofing checks
Build these activities into your annual budget as recurring line items. Schedule them on a calendar so they actually happen.
The payoff shows up over years, not months. Systems that receive preventive care last longer. Facilities that invest in preventive maintenance report fewer emergency repairs, less downtime, and lower total cost of ownership.
Practice 5: Use Facility Maintenance Software to Track Spending and Variance
Facility maintenance software turns your budget from a static spreadsheet into a living tool that tracks actual spending against plan, so you can adjust mid-year instead of discovering overruns in December.
Good facility maintenance software lets you:
- Log every work order and its cost
- Track parts and materials inventory
- Record labor hours by asset or category
The software also creates institutional knowledge. When a technician completes a repair, they log what was done, what it cost, and how long it took.
Many facility managers resist software because it feels like extra work.
Real Facility Maintenance Budget Examples and Line-Item Allocation
Understanding how other facilities allocate their budgets helps you build one that fits your situation. The breakdown varies by building type, age, and climate, but some patterns hold across most commercial facilities.
A typical commercial office building with 50,000 square feet might allocate its annual facility maintenance budget roughly like this:
| Budget Category | Percentage | Purpose |
|---|---|---|
| HVAC and systems | 25-30% | Filters, inspections, seasonal service |
| Plumbing and water | 15-20% | Pipe repairs, fixture maintenance, water quality |
| Electrical and lighting | 10-15% | Panel service, outlet repairs, LED upgrades |
| Roofing and exterior | 10-15% | Inspections, minor repairs, weatherproofing |
| Doors, frames, and hardware | 8-12% | Locks, hinges, frame repairs, weatherstripping |
| Flooring and interiors | 8-10% | Carpet cleaning, tile repair, paint touch-ups |
| Safety and security | 5-10% | Fire system testing, alarm service, camera maintenance |
| Contingency reserve | 10-15% | Emergency repairs and unexpected failures |
A healthcare facility or retirement home might weight HVAC higher (30-35%) because temperature control is critical for patient safety.
No two facilities have identical budgets. Your allocation should reflect your building's age, systems, climate exposure, and operational criticality.
Common Budget Mistakes and How to Avoid Them
Most facility managers make one or two predictable maintenance budget mistakes. Knowing them helps you avoid them.
Mistake 4: Not separating preventive and reactive maintenance budgets. Combined, reactive emergency repairs consume preventive funds.
Facility maintenance budgeting is about making intentional choices with limited resources.
Most facility managers face tight budgets and endless competing priorities. Door Innovation offers cost-effective alternatives to full replacements: our repair kits for corroded aluminum and rusted steel door frames extend asset life and free up budget dollars for other critical needs.
Start with the practices outlined here. Build your template, prioritize your assets, invest in prevention, and use software to track results.
Frequently Asked Questions
How do you create a facility maintenance budget?
Start by auditing all facility assets and their maintenance histories. Categorize expenses into preventive maintenance, reactive repairs, and capital improvements. Use historical spending data as your baseline, then adjust for inflation and planned replacements. Allocate 15-20% of your operating budget to maintenance, though this varies by facility type and age. Document all line items, labor, materials, contractor costs, and energy expenses, and review quarterly to track actual spending against projections.
What should a facility maintenance budget include?
A complete facility maintenance budget covers labor costs for in-house staff, contractor and service provider fees, parts and materials, energy and utility costs, preventive maintenance programs, equipment replacement reserves, compliance and safety upgrades, and contingency funds for unexpected repairs. Include line items for routine inspections, maintenance schedules, work order management, and asset tracking software. Don't forget training, certifications, and specialized tools your team needs to maintain building systems effectively.
How can facility managers reduce maintenance costs without compromising safety?
Focus on preventive maintenance, addressing small issues before they become expensive failures saves 25-30% on long-term costs. Implement a maintenance schedule that catches problems early and extends asset lifecycles. Use facility maintenance software to eliminate duplicate work and improve labor efficiency. Invest in energy-efficient upgrades to reduce utility costs. Prioritize assets by criticality so you're spending on what matters most. Train staff to handle routine maintenance in-house rather than calling contractors for every minor repair.
How often should a facility maintenance budget be reviewed?
Review your facility maintenance budget monthly to track actual spending against projections and catch overspending early. Conduct a full budget variance analysis quarterly to identify trends and adjust allocations. Perform an annual comprehensive review before the next fiscal year to account for inflation, equipment aging, new regulatory requirements, and lessons learned. If major unexpected expenses occur, like widespread corrosion in door frames, adjust your contingency reserves and update your deferred maintenance exposure calculations.